All three samples labeled—why doesn't that mean the entire range is risky?
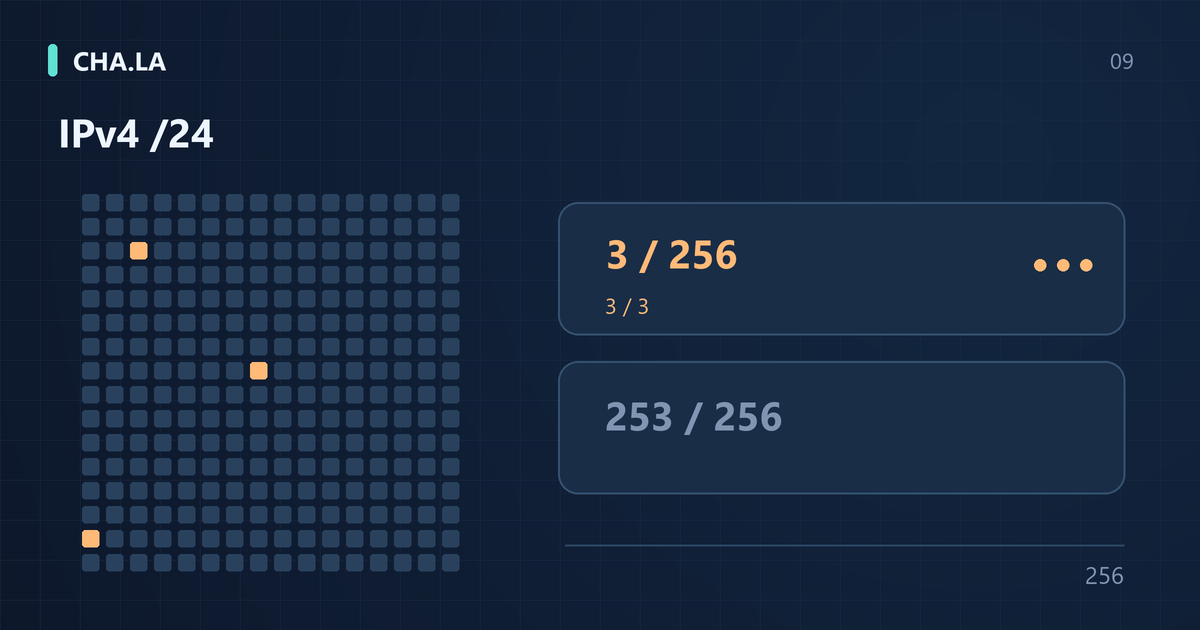
Suppose you see a /24 network summary view on an IP lookup page: recently only 3 IPv4 addresses have been observed, and all 3 carry risk labels. The interface might display "100% flagged." This is an easily misinterpreted number, but it only indicates that all addresses among the observed samples are labeled; it does not mean that all 256 addresses in the /24 are malicious. We explicitly state that this is a calculation example, not a measurement of a real network. In the 100% sample ratio, the numerator is the 3 observed addresses and the denominator is also the 3 observed addresses, yielding 100%, but the denominator completely omits the 253 unobserved addresses in the /24.
This misconception stems from treating the "observed portion" as the "whole." Many security backends, threat intelligence platforms, or routing alert interfaces default to displaying entries that appeared within a given time window; addresses outside the window, without traffic, or not hit by sensors will not appear in the numerator, nor will they change the 100% ratio. As long as many addresses remain unobserved, the percentage on the page does not support inference about the entire range. When readers see a 100% label ratio, they should first check whether there is a note like "based on recent observations" or "sample coverage."
In other words, having all 3 labels only shows that the 3 addresses seen recently have security annotations. It cannot be extrapolated to claim the entire /24 is extremely risky, nor does it conversely prove that these 3 are definitely malicious attack sources. For example, these 3 might all be from a Tor exit node, historically reported multiple times by scanners, but the other 253 addresses in the same /24 have never generated any alerts. If "all observed samples labeled" is treated as "entire range labeled," a small amount of behavior is misjudged as the reputation of the entire IP range—exactly the core bias this article aims to dissect.
Why write /24 instead of Class C network?
With Classless Inter-Domain Routing for IPv4, /24 means the first 24 bits are the network prefix and the remaining 8 bits are the host part, so the prefix contains 2 to the power of 8, i.e., 256 addresses, ranging from a.b.c.0 to a.b.c.255. Traditionally, people habitually call /24 a Class C network, but that is a legacy term. Before CIDR, IPv4 was divided by classes, and a Class C network had a default mask of 255.255.255.0, which superficially matches /24, but there are important differences in modern routing and statistical contexts.
According to RFC 4632, CIDR no longer relies on A/B/C class boundaries; any prefix length can be announced and aggregated. Actual routing prefixes are often not tidy /24s; for example, an organization might announce a /20, which spans 16 consecutive /24s, and a BGP route update or RPKI ROA prefix length may be longer or shorter. Therefore, treating a /24 as an independent network boundary does not always reflect the real topology. Neighboring addresses appearing in the same /24 does not mean they are under the same physical subnet, same tenant, or same route prefix.
There is another common confusion at the statistical level: in traditional subnet calculations, the number of usable hosts in a /24 is 254, because .0 is often treated as the network address and .255 as the broadcast address. However, in threat intelligence statistics, when evaluating the coverage or label coverage of an entire /24 prefix, the denominator should be the complete CIDR address set, i.e., 256, including .0 and .255. Using 254 as the denominator would slightly overestimate coverage; and if all 256 addresses are enumerated for reputation assessment, modern CIDR semantics must be explicitly used rather than the traditional Class C host count. Any context that says "Class C has 254 IPs" generally refers to usable hosts, not the statistical population for risk coverage.
Coverage, sample ratio, and full-range known-label ratio
When a /24 page shows three different percentages, the key is to clarify the denominator of each figure. Step one: coverage. Suppose the /24 has recently observed only 3 addresses; the denominator is 256, the numerator is 3, so coverage is 3÷256=1.171875%. It answers the question "What proportion of addresses in this prefix have we actually seen during this period?" not "How many addresses are problematic?" A low coverage number only indicates limited observations, not that the remaining addresses are clean or dangerous.
Step two: observed sample label ratio. The numerator is the number of labeled addresses among the 3 observed, and the denominator is the 3 observed addresses. If all 3 are labeled, the result is 100%. It answers "Among the few samples already seen, how many carry risk annotations?" This is a conditional ratio, not a whole-range ratio. Its limitation is that both numerator and denominator depend on the observation window, data sources, and label update frequency, and cannot represent the overall risk rate of the 256 addresses.
The third metric is the full-range known-label ratio: numerator is 3 known labeled addresses, denominator is 256, giving 1.171875%, about 1.17%. In this example, the other 253 addresses are unobserved and cannot be treated as queried but not matched. 3/256 means 3 out of 256 addresses are known to be labeled; it cannot be written as "about 1.17 out of 256." This is still label coverage, not the true malicious rate, because labels themselves may only describe hosting, VPN, or Tor usage.
Unknown addresses cannot be classified as safe or malicious
The 253 unlabeled addresses need to be broken down into different states rather than collectively called "safe" or "guilty." Unobserved, no match, data failure, and expired have different meanings in page annotations. Unobserved means no sensors, queries, or traffic events have recently seen these addresses; no match means they were queried but the database has no corresponding entry; data failure means the query did not produce a result due to timeout, format, or upstream source unavailability; expired means there was previously a label but it is no longer displayed due to time window shift or record invalidation.
Understanding these distinctions is important for readers to judge risk. For example, if an address times out when querying RDAP, BGP, or RPKI ROA, the resulting "unknown" has different credibility than an "unobserved" address that was never hit by a port scan. The former may be a temporary failure, while the latter may simply be unexposed. But in any case, "unknown" does not equal safe. Saying unlabeled is "verified safe" underestimates risk, while saying unlabeled is "potentially malicious" overestimates the threat. The correct approach is to check the Data sources and methodology link on the page to confirm data update frequency, label sources, deduplication rules, and time windows.
When assessing risk, unlabeled addresses should be placed separately into a pending observation state rather than directly incorporated into threat scoring. Mature operations teams track observation coverage, label proportions, and label update times simultaneously, and trigger alerts for database failures or insufficient coverage. For example, if 253 addresses in a /24 are unobserved, a security team that treats them as zero risk may miss latent malicious infrastructure; if it blacklists them all, it will generate many false positives. Distinguishing unknown from known negative data is the first step in identifying the reputation of an entire IP range.
Observation samples may have selection bias
Whether these samples are representative depends on the collection method. If samples come from alerts, reports, IOCs, or user-initiated queries, addresses that show anomalies or arouse suspicion may be more likely to enter the collection, while unregarded addresses appear less often. You should first understand how data enters the system; do not assume by default that they are randomly selected from the entire range when no sampling description is provided. The same sample size supports different conclusions if from random sampling versus alert-triggered collection.
If the collection channel is biased toward anomalous events, extrapolating the sample label proportion directly to the entire range may overestimate risk; other collection biases may also produce errors in different directions. Three samples all having labels can only describe the status of these three samples in the current source. Reporting overall estimates, confidence intervals, or margins of error requires clear sampling design, label definitions, and model assumptions; you cannot calculate a seemingly precise security conclusion for the whole range based solely on the 100% figure.
This is also why we repeatedly emphasize not to draw conclusions about an entire IP range from a small number of samples. An attacker can rent a small block of hosting IPs to launch scans, while most addresses in the same /24 may belong to legitimate cloud tenants; or three hosts in a /24 are controlled by a botnet while neighboring addresses are intact. Sample bias makes the 100% label proportion on the page more like an alert reminder than a range-wide risk probability. When interpreting such proportions, readers should check the data collection method, event deduplication logic, and active time window to avoid mistaking selection bias for population patterns.
First distinguish usage labels from behavior records
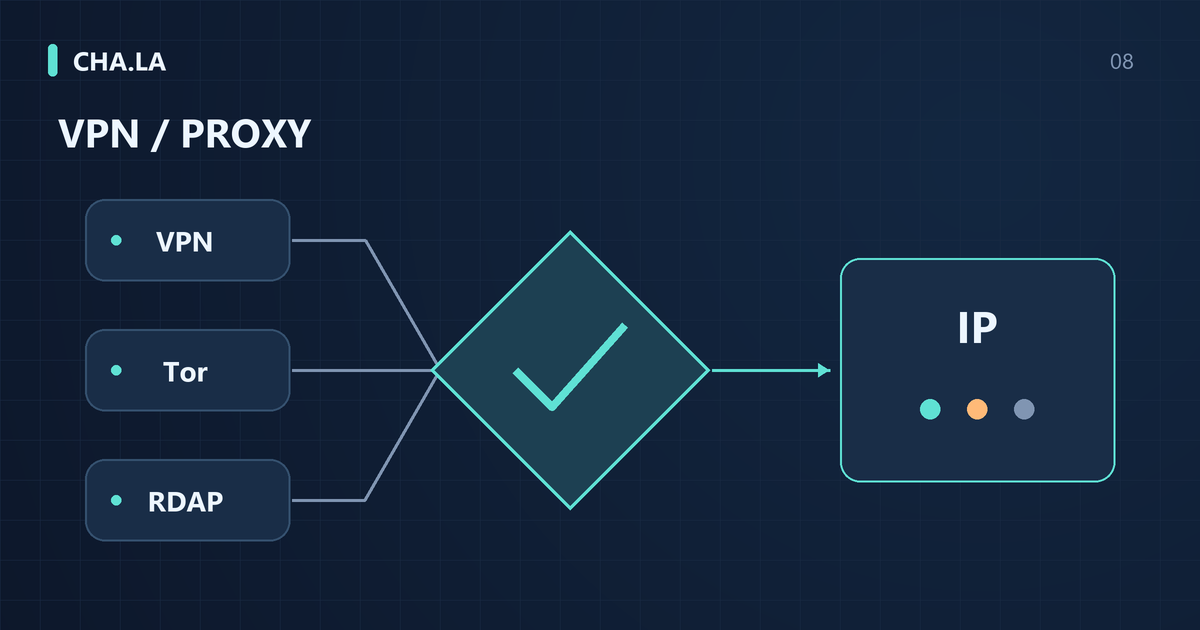
Even if a few addresses do have labels, not all labels can be equated with malicious intrusion. VPN, Tor, proxy, and hosting are usage or deployment clues; for example, the address may be an exit IP used by a public VPN provider. VPN and Tor are legitimate privacy tools in themselves, used daily by many ordinary users to access the internet, and commercial entities also forward traffic through proxy exits. Therefore, such labels are more like "infrastructure characteristics" than "malicious behavior classification."
In contrast, malicious scan reports, brute-force attempts, C2 communications, etc., are behavior-type labels, typically from security devices or third-party sources. The weights and false-positive risks of the two differ. Hosting IPs are often labeled as VPN, proxy, and scan sources simultaneously, because attackers also rent cloud hosts or proxy exits, but this infrastructure also has many legitimate uses; hosting or proxy status alone does not establish that a request is malicious. Duplicate sources and historical entries cannot be treated as independent evidence: the same address cited by ten intelligence interfaces does not equal ten independent events; it is likely just propagated copies of the same data source, causing duplicate counting. You can understand from IP Flagged as a VPN or Proxy? How to Check a False Positive why VPN or proxy labels cannot be directly used as a basis for blocking.
In actual operations, label type, first-seen time, evidence source, and deduplication identifier should be distinguished. For example, an address from a hosting provider with only a "Tor exit" label should not be treated the same as an address from a domain controller alert with a "lateral movement scan" label. The former's risk stems more from anonymous traffic being hard to audit, while the latter is directly associated with internal intrusion indicators. If a page categorizes both as "high risk" and shows percentages, it misleads readers into thinking the entire /24 needs to be blocked. Understanding label semantics helps keep network segment risk within a reasonable range.
Same network segment, ASN, and tenant are not the same thing
A /24 segment contains 256 IPv4 addresses, from .0 to .255, rather than the commonly said 254 usable host addresses. This difference arises from historical reasons: in early classful networks, Class C addresses defaulted to a subnet mask of 255.255.255.0, with network and broadcast addresses not assignable to hosts. In modern CIDR deployment, /24 is just a prefix length and does not automatically designate network and broadcast address roles; however, in many carrier and cloud environments, /24 is still often used as an allocation or management unit. Therefore, when observing a /24 segment, the statistical denominator should be all 256 addresses, not 254. Otherwise, sample coverage is overestimated and the unknown part underestimated.
Adjacent addresses do not prove same tenancy. Two IPs in the same /24 may be assigned to completely different customers, may belong to different virtual machines under the same cloud tenant, or may have been used by different users at different times. The same ASN only indicates that these addresses are announced through the same autonomous system, which may be a large cloud provider or carrier serving thousands of independent customers. The same BGP prefix only represents an aggregate in the routing table; actual allocation may be finer, such as a /20 split into multiple /24s assigned to different departments or downstreams. Therefore, you cannot infer that other IPs in the same segment are risky just because one IP is labeled malicious.
The actual BGP announcement may be a /20, or more specific prefixes may exist; /24 is often just a statistical window in reputation pages. Attack activity involving a few addresses cannot prove the rest are safe or malicious. You can verify the routing scope and observations provided by the page through IP prefix lookup and BGP route lookup, and then check the registration scope via RDAP. The objects and granularity presented by each tool may differ; you cannot treat route aggregation directly as tenant boundaries.
How time windows change the profile
A network range’s risk profile depends on observations within a defined time window. Suppose that only 3 addresses in a /24 were observed during the past 7 days, all 3 have malicious-activity labels, and the other 253 have no observation records. Observation coverage is then 3/256, about 1.17%; the label rate among observed addresses is 100%; and the known-label share across the whole range is 1.17%. This calculation depends on only 3 addresses having been observed. You cannot derive the same coverage merely from 3 labeled and 253 unlabeled addresses. An address that was checked without a match is different from one that was never observed, and these numbers do not establish whether the remaining addresses are safe.
The time window affects proportions. If a provider recently cleaned up abusive resources, malicious IPs may have been taken offline, and their labels may have disappeared; if tenants migrated, previously labeled IPs may have been reassigned to legitimate users; if observation paused or data source updates were delayed, the sample size will shrink. These changes can make the sample proportion at a given moment look cleaner or dirtier, but that does not mean the real risk has changed. Therefore, when comparing data from different points in time, you must confirm that the time window and update time are consistent.
We cannot claim what proportion of internet IPs this site covers, because there is no unified observational universe. Any prefix profile based on a small sample is only a partial snapshot. When users see a label disappear within a /24, they should check whether the prefix has new observation records or whether data sources have been updated, rather than directly assuming security has improved.
Operational Troubleshooting: First Look at Direct Evidence for the Target Address
After receiving an alert, first look at event evidence for the target IP itself, such as timestamped flow logs, application requests, security device records, and verifiable list entries. RDAP and BGP provide registration and routing context, but are not direct evidence of malicious behavior; passive DNS associations also need to be checked for time and purpose. Labels on neighboring IPs can only serve as context for further investigation, and cannot replace evidence from the target address itself; nor can a change in ASN alone be used to infer that a tenant has changed.
A few labeled neighbors do not automatically trigger blocking. Suppose 5 IPs in a /24 are labeled as malicious. These 5 IPs might be nodes of the same attacking organization, or they might be different customers each compromised. If the target IP has no evidence of malicious behavior, blocking it solely because it has malicious neighbors in the same prefix could harm legitimate users. You should record evidence, note the sample coverage, and assign a reviewer with a regular review schedule.
Consider another hypothetical scenario: in a /20, one /24 has 3 IPs with behavior labels observed, and 253 addresses have no observation data. Even if the three labels look similar, they may come from repeated propagation from a single source rather than three independent events. The next step should be to verify the source, time, and records of the target address itself, while leaving the tenant relationship as still unknown. This is an example to illustrate the order of judgment, not a measurement of any real prefix.
What to Ask Vendors When Procuring
When procuring network services or IP intelligence, do not rely solely on a vendor's claimed "purity." Ask what the data sources are: self-built honeypots, third-party blacklists, or passive DNS; whether updates are real-time, daily, or weekly; what the coverage denominator is, and whether it includes all 256 addresses; and whether specific entries can be exported for verification. If a vendor cannot provide these details, its "purity" promise is not credible.
Do not accept a “100% clean” guarantee. Any type of network can have a history of abuse or issues related to shared egress: devices on residential networks can become infected with malware, and addresses marketed as “native” can still be abused by tenants. Vendors can provide statistics based on their observations, but those statistics cannot guarantee absolute safety. Ask for the correction process, expected response time and appeal channel, and distinguish service commitments from verified facts.
Categories such as residential, mobile, and hosting describe different network contexts, and you cannot directly infer which is more likely to be malicious from the category alone. Dynamic allocation, shared usage, data coverage, and target service policies all affect actual experience. When reading Residential, ISP-Hosted and Datacenter IPs: Key Differences, you should break down marketing labels into verifiable access, usage, and allocation conditions, and then agree on acceptance criteria for specific business scenarios.
How to Present Prefix Profiles Without Misleading
When developers design prefix profile interfaces, they should simultaneously display the total address count (e.g., 256 for a /24), the number of observed addresses, the number of labeled addresses, and the number of unknown addresses. This makes the sample coverage intuitively visible. For example, with 3 observed addresses, 3 labeled, and 253 unknown, display as "Coverage 1.17%, Known Labels 1.17%." Do not show only the malicious label proportion, as that would mislead users.
Color legends should distinguish different uses and behaviors, such as normal, malicious, suspicious, and no data. No data should not be conflated with safe; gray can represent unknown. Do not use a /24 grid where each cell represents one IP to visualize IPv6, because an IPv6 /64 has 2^64 addresses and cannot be mapped to 256 cells. Instead, use aggregated statistics or sampled visualization.
Using the CIDR calculator can quickly confirm the number of addresses contained in a prefix. For IPv6, presentation should avoid implying the error that "neighbors within a /64 are equivalent to a tenant." For example, in IPv6, a /64 is typically assigned to a subnet, but the same subnet may contain multiple containers or virtual machines.
Common Questions and Verification Checklist
Whether an anomaly at one address affects neighbors depends on whether the target service enforces rules based on single IP, prefix, ASN, or other signals; one cannot assert which approach most websites use without evidence. Zero labels only means no matches under specific data and rules, not proof of security. Observing all 256 addresses does not mean all are labeled; even if every address has some label, it still does not prove that a single person controls the entire prefix. Coverage, label meaning, and user attribution are three separate issues.
The verification checklist includes: total address count, observed address count, labeled address count, unknown address count, time window, data sources, BGP prefix, and RDAP registration information. Confirm these before making decisions. Do not conclude from a single number.
For further reading, use the IP Reputation Check: Risk Scores, Blocklists and Proxy Tags and RDAP, ASN, BGP and RPKI: What IP Lookup Data Can Prove. These two guides help you understand how to collect and interpret direct and indirect evidence about IPs, avoiding treating a small sample as the reputation of an entire prefix.